Record Rainfall in Fort Lauderdale

NOAA NWS Rainfall Estimate

Reord rainfall in Fort Lauderdale. A stationary supercell thunderstorm that centered itself near Fort Lauderdale, Florida produced prolonged periods of 3+ inch hourly rainfalls creating widespread flooding. The heaviest rainfall, in excess of 20 inches, appears to have occurred from Ft. Lauderdale to Hollywood. It has been estimated that up to 1.5 inches of rain fell in 10 minutes in Fort Lauderdale!

Early on the morning of April 12th, there was a weak 1010 mb low over the central Gulf of Mexico with a slow moving warm front extending eastward to the Florida Keys. Over the northeastern Gulf surface winds were 25-35 kts from the east.

NOAA NWS Surface Analysis 1200 UTC 12 April 2023

Higher-up in the atmosphere there was a cut-off 500 mb low centered over southeastern Louisiana which was causing a strong wind flow from the WSW across South Florida. At the surface  a long fetch of moderate to fresh moist ENE winds prevailed along the southeastern coast of Florida to the north of the warm front.  

NOAA NWS 500 MB ANALYSIS

By mid-afternoon, the low was drifting slowly northward while the associated warm front had moved north of the Keys but was still located to the south of the Miami area. The intersection of the warm front, the strong upper-level WSW winds over moderate to fresh moist ENE winds at the surface created strong vertical wind shear with high moisture levels in the low and mid levels, an ideal environment for heavy convective showers and thunderstorms. 

NOAA NWS Surface Analysis 1800 UTC 12 April 2023


A cluster of nearly stationary heavy thunderstorms developed along the Southeast Coast of Florida with the heaviest activity from Fort Lauderdale to Holiday. The combination of impervious surfaces of a highly urbanized area with extreme rainfall rates caused severe surface rainfall runoff which resulted in enhanced street flooding and flooding of airport runways. 

Whether or not the rainfall amount was enhanced by climate change is debateable, however, the effects of urbanization are likely the main reason for the overall impact of the flooding. 


Fred Pickhardt


Posted in Climate Change, Floods, Severe Weather Events | Tagged , , , , | Leave a comment

Winter Hurricane Force Storm over North Atlantic

A complex low pressure system extended from the Great Lakes to off the US East Coast on the 23rd moving rapidly eastward.

NOAA Satellite Image


By early on the 25th the now rapidly deepening system was consolidating into a single hurricane-force storm system southeast of Newfoundland. 

NOAA OPC Surface Analysis 25 Feb 2023 1200Z


During the next 18-24 hours the storm deepened rapidly to a 944 mb storm east of Cape Race with winds of 60-80 knots and significant wave heights of up to 14.5 meters (48 ft) within 240-300 nm south and west of the center.

NOAA OPC Surface Analysis 26 Feb 2023 1200UTC


NOAA North Atlantic Wave Height Analysis


Learn more about these Winter Hurricanes here


Fred Pickhardt

Ocean Weather Services 


Posted in Hurricane-Force, North Atlantic, Weather Routing | Tagged , , , , | Leave a comment

Rapidly deepening Storm over NW Pacific

NOAA OPC Western Pacific Surface Analysis 12Z 27 Jan 2023

A rapidly deepening gale low east of Japan will move northeast, deepen to 952 mb with winds to hurricane force up to 70 kts and significant wave heights building to to 14.5 meters (48 feet) over the next 24-48 hours. The storm will turn northward and pass over the western Bering Sea, then traking northwest and weakening near Kamchaka.


NOAA OPC Surface Forecast for 12Z 29 Jan 2023 

NOAA OPC Wave Height ForecastEach year there are, on average, about 6 hurricanes in the North Atlantic, 8 in the Eastern North Pacific and 17 Typhoons in the western North Pacific. Few people (outside of Mariners) realize that there is another season of hurricane winds that occurs over both the North Atlantic and the North Pacific Ocean and runs from September to May. These storms do not track through the tropics, but instead are associated with the extratropical cyclones of the mid-latitudes.

Link  https://oceanweatherservices.com/blog/2021/11/03/the-other-hurricane-season/


Posted in Hurricane-Force, North Pacific, Ocean Storms | Tagged , , , | Leave a comment

Pacific Hurricane Force Storm

Developing Storm Low

A rapidly intensifying low over the west-central North Pacific will move east-northeast  producing storm to hurricane force winds (possibly up to 70 knots) with significant wave heights up to 14.5 meters (48 feet) over the next 36-48 hours. Highest conditions are expected south of the center between 36N and 42 N latitudes.

Forecast indicate that this system will weaken as it moves northeast and approaches the US West Coast with wind, rain, and snow Wednesday into Thursday.


NOAA Surface Forecast

Posted in Hurricane-Force, North Pacific, Ocean Weather, Severe Weather Events | Tagged , , , | Leave a comment

Hurricane Force East Pacific Storm off US West Coast

Sat plus wind

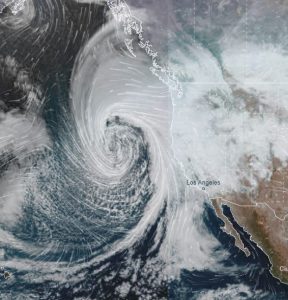
NOAA GOES Satillite image with wind streams via Ventusky

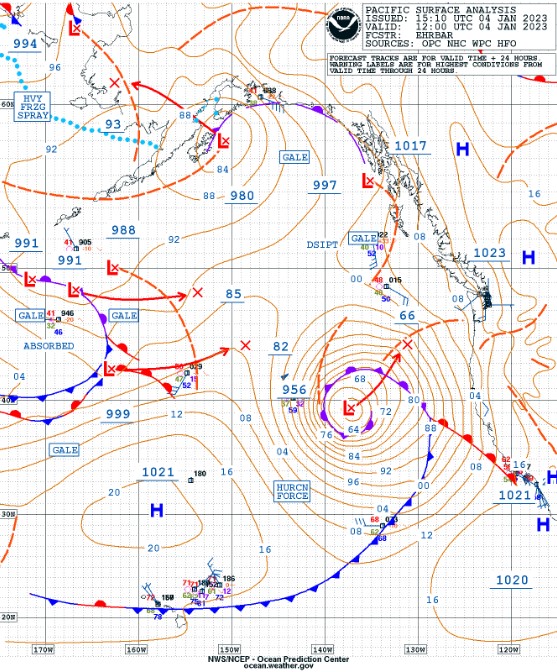
An intense storm low over the eastern North Pacific is currently moving towards the northeast at about 20 kts and is producing winds of 50-70 knots with significant wave heights up to 12.5-13.5 meters (41-45 feet) within 120-360 nm south and west of the center.

NOAA forecasters have issued gale to storm warnings along the entire US West Coast where hurricane force wind gusts are possible along with heavy rain and snow over land.


12Z Surface

NOAA OPC 1200Z Surface Analysis


The Other Hurricane Season  

Each year there are, on average, about 6 hurricanes in the North Atlantic, 8 in the Eastern North Pacific and 17 Typhoons in the western North Pacific. Few people (outside of Mariners) realize that there is another season of hurricane winds that occurs over both the North Atlantic and the North Pacific Ocean and runs from September to May. These storms do not track through the tropics, but instead are associated with the extratropical cyclones of the mid-latitudes.   Read More Here 


Posted in Hurricane-Force, North Pacific, Ocean Storms | Tagged , , , | Leave a comment

Late July Heavy Rains and Flooding in the Midwest

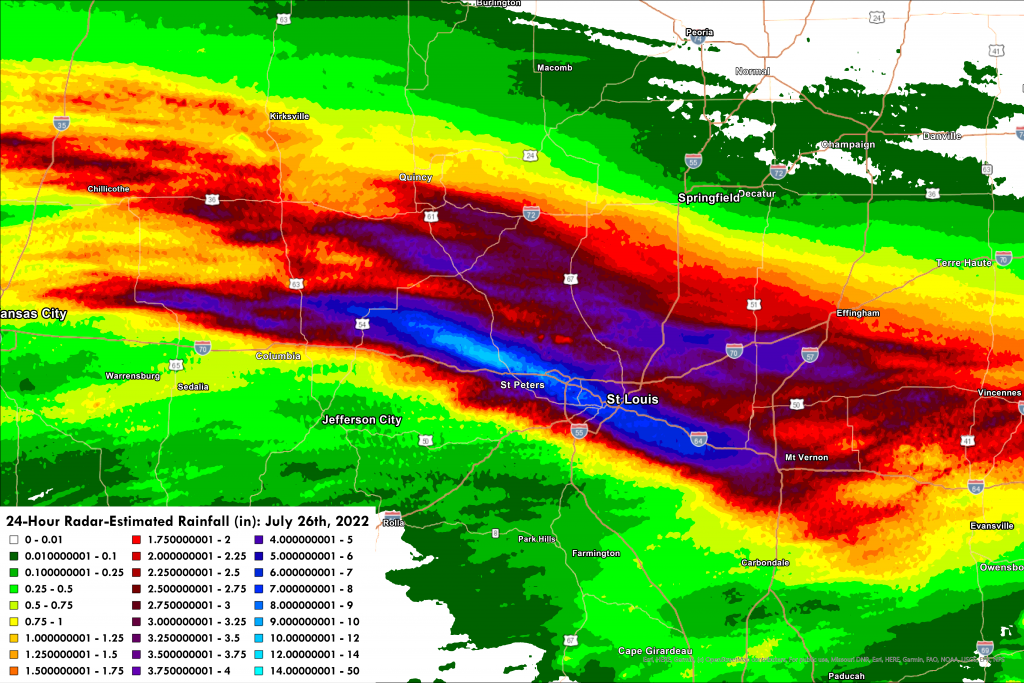
Flood imageSignificant flash flooding during the early morning of Tuesday, July 26th, 2022, occurred along the I-70 corridor in Missouri and I-64 corridor in Illinois. Multiple thunderstorms with rainfall rates exceeding 2in/hr. affected this area, including the St. Louis metropolitan area with up to 12 inches of rain falling from northern Montgomery County in Missouri to St. Clair County in Illinois. The storm caused multiple swift water rescues and scores of flooded interstates and homes across the St. Louis metropolitan area.  One fatality was reported in St. Louis City, where a man drowned in his car.

These thunderstorms caused a narrow, but intense swath of heavy rainfall: most of the area saw at least a few inches of rainfall with a narrow band of 6 to 12 inches stretching from east central Missouri to southwest Illinois.

rainfall map

Multi-Radar Multi-Sensor (MRMS) 24hr Radar-Estimated Rainfall as of 12pm on July 26th.


In addition, deadly and destructive flooding is also occurring in Kentucky and other parts of Appalachia July 28th-30th as several inches of rain have fallen over the area in a short period of time and is a life-threatening situation similar to the disaster in St. Louis earlier this week.   Floodwaters have claimed at least 25 lives in Kentucky and have washed away homes, roads, and bridges. Kentucky’s governor expanded a state of emergency declaration and said the death toll was likely to increase.Flood Map

What is the cause?

The heavy rain fell north of a stationary front (a boundary between warm humid air and cooler air to the north) across southern Missouri and Illinois, and eastward into Kentucky. Strong low-level winds (around 5,000 feet) brought in high amounts of low-level moisture which interacted with the front and with an upper-level jet stream to the north and produced a mesoscale convective system (complex of thunderstorms moving across the same area for more than 6 hours). This type of weather pattern is not unusual as there have been many similar warm-season heavy rainfall events in the central US in the past that were produced by mesoscale convective systems (MCSs) that developed above and north of a surface front in the past.

A conceptual model for the meteorological setup of the flash flooding event that occurred on July 26th, 2022 in the St. Louis metropolitan area. Image Credit NOAA NWS St. Louis


A paper written by Moore et al. (2003) found that the heavy-rain region of elevated MCSs is located, on average, about 160 km (100 miles) north of a semi stationary frontal zone, in a region of low-level moisture convergence that is elongated westward on the cool side of the frontal boundary.

In an earlier paper published by NOAA in 1994, stated that “flash flooding often results from intense, long-duration rainfall associated with MCSs. During the summer of 1993, the continuous development and movement of  MCSs over portions of the Missouri and upper Mississippi River  basins  for  several  months  contributed  to  numerous individual flash-flood events and prolonged large-scale river  flooding,  resulting  in  48  fatalities  and  economic losses  estimated  at  $20  billion”.

A conceptual model for the meteorological setup of the flash flooding event that occurred on July 26th, 2022 in the St. Louis metropolitan area. Image Credit NOAA NWS St. Louis


References

July 26th, 2022 Historic Flash Flooding in the St. Louis Metro Area, NOAA NWS Office, St. Louis Mo.

Moore et al. (2003) in the AMS Weather and Forecasting journal, The Environment of Warm-Season Elevated Thunderstorms Associated with Heavy Rainfall over the Central United States

NOAA,  1994:  The  Great  Flood  of  1993.  Natural  Disaster  Survey, NOAA, Rockville, MD

Junker,  N.  W.,  R.  S.  Schneider,  and  R.  A.  Scofield,  1995:  The  meteorological conditions associated with the great Midwest flood of  1993.  14th  Conf.  on  Weather  Analysis and  Forecasting, Dallas, TX, Amer. Meteor. Soc.,


Posted in Floods, Severe Weather Events, Weather History | Leave a comment

Heat Wave in Western Europe tied to Sea Temperatures?

temp anomaly

2m Temperature Anomaly Forecast

Another heat wave is currently developing over Western Europe and the media are pointing the finger at climate change but more likely is a result of a growing area of negative sea surface temperature (SST) anomaly that has developed over the eastern North Atlantic that is enhancing undulations in the jet stream.


Currently below normal SST anomalies have developed over the eastern North Atlantic with the greatest negative anomaly between the Azores and the coast of Portugal while positive anomalies remain over the western Mediterranean, Bay of Biscay, English Channel and Baltic Sea. 

Sea Surface Temperature Anomaly (C)


These conditions tend to favor upper-level troughs to develop over the eastern North Atlantic with ridging building over western Europe, and in fact is the current situation.  As the upper-level ridge builds over western Europe, the air temperatures at the surface increase accordingly.  Over several days the ridge will drift eastward spreading the heat into central Europe. 

250 mb Wind Forecast


Whether or not the SST anomalies are associated with climate change is open to debate.  

Ref:   Impact of North Atlantic SST and Jet Stream anomalies on European Heat Waves,  Julian Krüger et al.  


Posted in Climate Change, Meteorology, North Atlantic | Tagged , , | Leave a comment

Tropical Storm Bonnie forms over Southwestern Caribbean

Satellite image TS Bonnie over the southwestern Caribbean Sea

The disturbance that has been tracking across the southern Caribbean Sea has intensified into Tropical Storm Bonnie based on an Air Force Reserve Hurricane Hunter finding a well-defined circulation center located about 100 n mi east of the Nicaragua coast. The max winds are still only about 35 knots. Bonnie is moving just south of due west at 260/17 knots and is forecast to emerge over the tropical North Pacific on Saturday.

Bonnie remains in a low-shear and warm SST environment and is forecast to intensify during the next 12 hours prior to landfall. Heavy rainfall is likely across portions of Nicaragua and Costa Rica today into Saturday. Areas of life-threatening flash flooding and mudslides are expected.  Tropical storm conditions are expected on San Andres today, along the Caribbean coasts of Costa Rica and Nicaragua within the Tropical Storm Warning areas by this evening, and along the Pacific coasts of Costa Rica and Nicaragua overnight and early Saturday.

NHC Forecast Track TS Bonnie

Posted in Ocean Storms, Tropical Cyclones | Tagged , , , | Leave a comment

Potential Tropical Cyclone Two nearing Caribbean

sat photo

Satellite Image with surface wind field

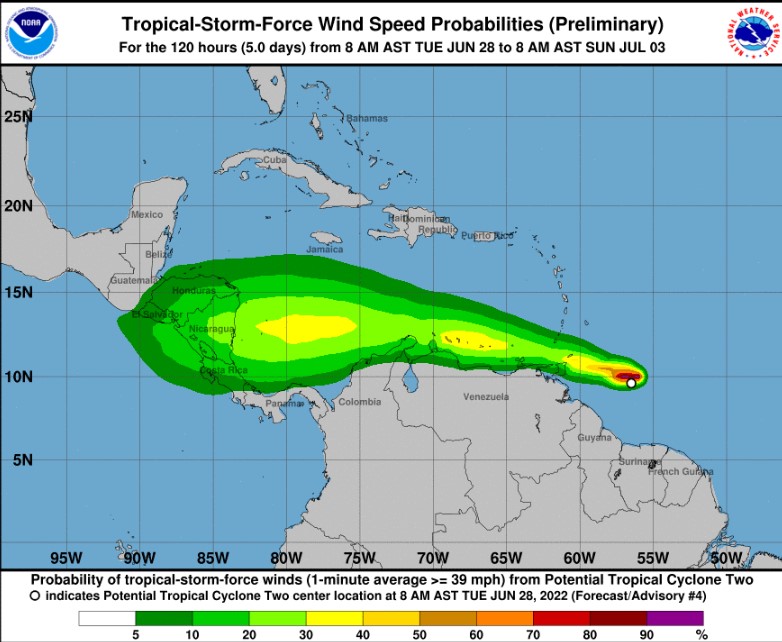
Potential Tropical Cyclone Two continues to produce vigorous deep convection and also exhibits some banding features, however, reports from an Air Force Hurricane Hunter aircraft indicate that there is no well-defined center of circulation.  Interaction with land and fast forward motion will likely limit intensification until the system reaches the southwestern Caribbean Sea later this week when significant strengthening is possible.

wind risk

NHC Risk for Gale Force (Tropical Storm) winds

Heavy rainfall is expected across the Windward Islands and northeastern Venezuela tonight through Wednesday. Winds to tropical-storm-force are expected over portions of the southern Windward Islands tonight, over Islas Margarita Wednesday morning, and over the ABC Islands by Wednesday evening.  Tropical storm conditions are possible along the northeastern coast of Venezuela tonight and Wednesday evening.

Posted in Cruise Weather, Ocean Storms, Tropical Cyclones | Tagged , , , , | Leave a comment

How’s the Weather Cruising the North Atlantic during July?

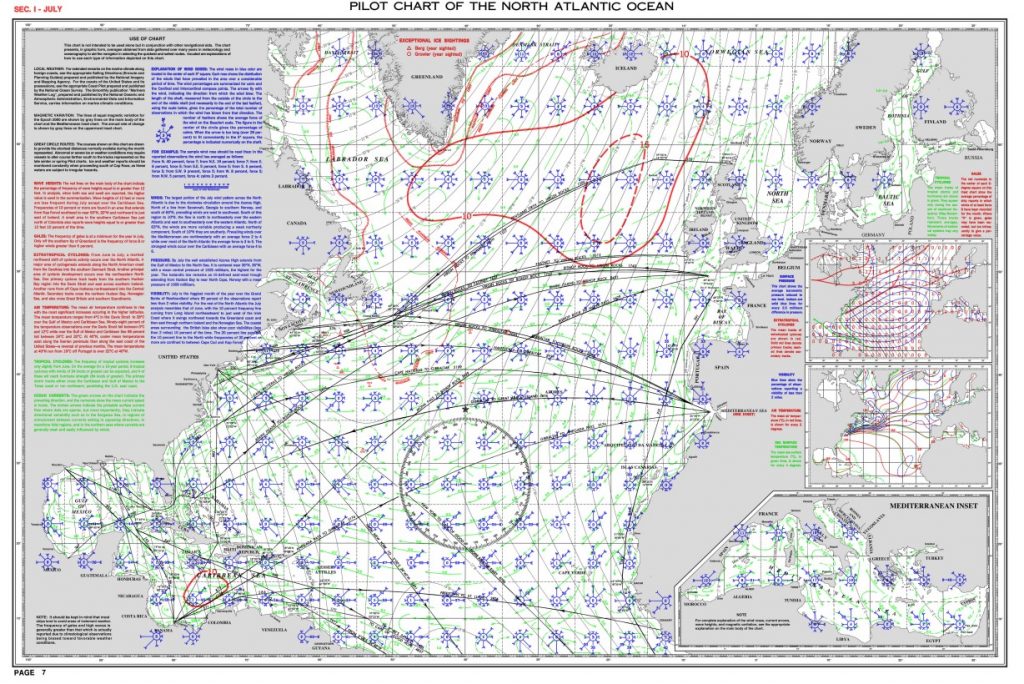
July Pilot Chart

PILOT CHART NORTH ATLANTIC JULY

Overview

During the month of July, the Azores to Bermuda High dominates the North Atlantic weather extending from the North Sea to the Gulf of Mexico with a mean center near 35N/35W.    Storm tracks have shifted north of 50 North latitude, except for one primary track from off the Carolina Coast northeastward towards the Denmark Strait. 

Fog occurrence during July is 10% or higher north of a line from Long Island to Ireland. July is also the foggiest month of the year over the Grand Banks with a 40% to over 50% risk for visibility of 2 miles or less. Icebergs can still be found southeast and east of Newfoundland during July 

Wind and Waves

South of the Azores-Bermuda high to about 10 N latitude, winds tend to be from the northeast to east averaging Beaufort force 4 (11-16 knots) with waves mostly about 1-1.5 meters (3-5 feet),  except winds tend to be more northerly off the coasts of Iberia and northwestern Africa. Northeast to east winds average Beaufort Force 5 (17-21 knots) with waves around 2 meters (6-7 feet) prevailing over the central Caribbean Sea. South of 10 N, winds are more likely to be from the south at Beaufort Force 3 (7-10 knots) with waves 0.5 meters (2 feet) or less. 

North of the Azores-Bermuda high winds tend to be mostly from the southwest to west averaging Beaufort Force 4 (11-16 knots) with waves mostly about 1-1.5 meters (3-5 feet).

Gale Risk

July Surface Pressure, Storm Tracks and Gale Risk

July Surface Pressure, Storm Tracks and Gale Risk

The risk of encountering gale force (Beaufort Force 8/34 knots) or higher winds is near zero south of about 35 N latitude this month.  Between 35 N and 50 N latitudes, the risk for gales is low at 1% or less and north of 50 N latitude the risk is only 1-4 %. 


Temperatures

The air temperatures range from 4 C (39 F) in the Davis Strait to about 28 C (82 F) over the Southwest North Atlantic, Gulf of Mexico and Caribbean Sea.  Sea surface temperatures range from under 5 C (41 F) in the Davis Strait to about 28-29 C (82-84 F) in Gulf Mexico, Caribbean and the southwestern North Atlantic.

Tropical Cyclones

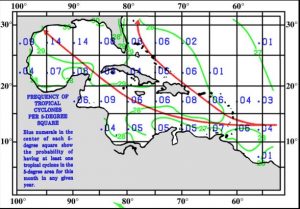
There is an increasing risk for tropical cyclone development during July with the highest risk (14%) occurring in the north-central Gulf of Mexico. 

Pilot Chart TC Frequency North Atlantic July

Pilot Chart TC Frequency North Atlantic July

Posted in Climatology, North Atlantic, Tropical Cyclones, Weather Routing | Tagged , , , , | Leave a comment