About Optimum Ship Routing

A short history of weather routing

The earliest form of ship routing may have been when early humans used the prevailing easterly winds to sail from island to island in the Pacific or when Arab traders sailed portions of the  Indian Ocean based on the prevailing monsoons.

By the time of Columbus, Portuguese sailors had taken advantage of their knowledge of the prevailing trade winds and helped Portugal become a powerful maritime power. When Columbus set forth on his voyage of discovery he used the prevailing trade winds to carry his fleet to the New World and then took the more northerly route for his return taking advantage of the prevailing westerly winds.

Benjamin Franklin, in 1786 noted that “vessels were “sometimes retarded and sometimes forwarded in their voyages by currents at sea”. He knew that ships coming from Falmouth to New York took a fortnight longer than those coming from London to Rhode Island.

Franklin consulted a Nantucket sea captain regarding this and was told that the cause was the Gulf Stream. (Nantucket captains knew of the Gulf Stream because of the whaling trade.) That same captain marked the stream on a chart along with directions for avoiding it.


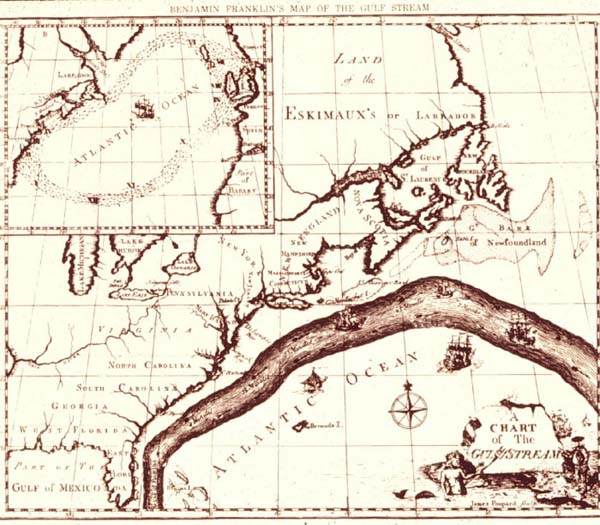
The Gulf Stream by Benjamin Franklin. Courtesy of NOAA Photo Library

Modern ship routing ideas began during the early stages of WWII when the US Navy established the “Naval Meteorology and Oceanography Center” at the Naval Air Station in Norfolk. in 1958 “Optimum Track Ship Routing” (OTSR) was started to provide tailored safety and cost saving routing services to all ships utilized by the military for long duration open ocean voyages.

Commercial marine weather routing had it start in the 1950’s when Howard Kaster, a meteorologist for United Airlines, started a company called “Pacific Weather Analysis Corporation” which later evolved into Ocean Routes in 1967 under Ray Maier and Bill Dupin.

Other pioneers of commercial ship routing in the 1960’s included Bill Kaciak the founder of “Weather Routing Inc.”, TV weather man Louis Allen who started “Allen Weather Corp” and “Bendix Marine Science Services” under Robert A Raguso which began routing operations in 1968.

What is Optimum Ship Routing?
Optimum ship routing is the art and science of developing the “best route” for a ship based on the existing weather forecasts, ship characteristics, and special cargo requirements. For most transits this will mean the minimum transit time that avoids significant risk to the vessel, crew and cargo. The goal is not to avoid all adverse weather but to find the best balance to minimize time of transit and fuel consumption without placing the vessel at risk to weather damage or crew injury.

Route planning normally will start be reviewing the appropriate Pilot Chart Atlases and Sailing Directions (Planning Guides) to determine the normal weather patterns, weather risks and prevailing ocean currents. The Routing Service then reviews recent weather patterns and weather forecast charts to determine the most likely conditions during the course to the voyage.

A preliminary routing message is transmitted to the master of a vessel prior to departure with a detailed forecast of expected storm tracks, an initial route proposal with reasoning behind the recommendation and also the expected weather conditions to be encountered along that route. This allows the master to better plan his route and offers an opportunity to communicate with the service any special concerns that he or she might have due to special cargo requirements or ship condition. Once the vessel departs, the vessel’s progress is monitored closely with weather and route updates sent as needed.

Fred Pickhardt

http://oceanweatherservices.com/

Posted in Meteorology, Weather History, Weather Wisdom | Tagged , | Leave a comment

TC Chapala moves towards the coast of Yemen

Tropical Cyclone 04A (CHAPALA)

Tropical Cyclone 04A (CHAPALA) at 15Z 31 October was centered about 209NMENE of Socotra Island and was moving westward at about 08 knots with max winds to 115 knots.  Currently hurricane force winds extend outward only about 25-30 NM.


Chapala is forecast to weaken as it approaches the coast of Yemen but likely will retain hurricane strength at landfall north of Mukalla about 21Z 02 November.

JTWC Forecast Track

Posted in Ocean Storms, Tropical Cyclones | Leave a comment

Tropical Cyclone Chapala intensifies over Arabian Sea

Wednesday 29 Oct. 2015: A rapidly developing Tropical Cyclone (Chapala) over the Arabian Sea has reached hurricane strength as it moves towards the WNW at about 8 knots.  At 15Z 29 October, Chapala was centered about 446NM southeast of Masirah Island. Chapala is forecast to strengthen to 100 knots or more during the next 36-48 hours, reaching 110-120 knots max winds in about 72 hours.


The latest forecast track has Chapala making landfall over the Al Mahrah district of Yemen around 15Z 02 November.

Posted in Ocean Storms | Leave a comment

Large Storm over the Northeastern North Atlantic

North Atlantic Surface Analysis:  NOAA OPC

North Atlantic Surface Analysis: NOAA OPC

A large and deep storm over the northeastern North Atlantic is producing winds of 40 to 60 knots.

Posted in Ocean Storms | Tagged , | Leave a comment

Mariner’s Guide to Ocean Waves

There are five types of ocean waves:

1. Wind generated
2. Tides
3. Seiches
4. Tsunamis
5. Pressure induced

1. Wind-Generated

Wind-generated waves are the most common waves found on the ocean and are the result from stress on the water surface caused by the wind. The smallest of these are capillary waves which can be quickly brought back to equilibrium solely by the cohesion of the individual water molecules. Most wind-generated waves, however, are referred to as gravity waves since it is gravity that acts to restore them to equilibrium. Wind driven waves are the waves that have the greatest impact on ships.

2. Tides

Tides are the rise and fall of sea level caused by the gravitational attractions of the moon and sun and by the centrifugal force of the spinning earth.

When the solar and lunar gravitational forces are in line they combine to create the highest of the high tides and lowest of the low tides which are referred to as “spring tides.” When the forces are perpendicular to each other, the forces are pulling the water in different directions so the difference between high and low tides are minimized and is referred to as a “neap tide”.

An illustrated guide to tides can be viewed HERE.

3. Seiches

 Image Credit: Keith C. Heidorn, PhD The Weather Doctor’s Weather Almanac Sloshing The Lakes: The Seiche

Image Credit: Keith C. Heidorn, PhD The Weather Doctor’s Weather Almanac Sloshing The Lakes: The Seiche

A seiche is the sloshing of water back and forth in lakes and other large bodies of waters. Seiches can be caused by a disturbance such as an earthquake or landslide, changes in air pressure, or changes in the wind. The most common cause of seiches are persistent strong winds blowing along the long axis of large water body causing a rise in the water level at the down-wind side and a lowering of the water level at the up-wind end.

When the wind abates, the water is released as a seiche wave. Flooding and erosion can occur at one end of the lake, while at the other end the decreased water depth can cause hazards to ship navigation.

4. Tsunami

Recent events in Japan have focused our attention on tsunamis. Tsunamis are long-period waves generated by undersea earthquakes, volcanic eruptions and landslides. In the open deep oceans a tsunami will have extremely long wavelengths with small amplitudes and might go unnoticed by ships. Tsunami waves travel at very high speeds, often at hundreds of miles per hour through deep water but as the tsunami waves reach shallow water near the coast, they begin to slow down while gradually growing steeper, due to the decreasing water depth and can grow to tens of meters or more as they reach the shoreline. The effects can be further amplified where a bay, harbor, or lagoon funnels the waves as they move inland and well document during Japan’s recent event. Another potential cause of a tsunami is an asteroid impact in the deep ocean which could produce a tsunami wave of over 100 meters (more than 330 feet)!

5. Pressure Induced

The 5th but less significant type of wave develops as air pressure perturbations move over the water surface. The sea surface height rises or falls slightly as the atmospheric pressure changes. Low air pressure within a strong storm can elevate the ocean’s surface up to 0.5m (1.6ft), creating an atmospherically forced pressure wave beneath the storm.

Wave Definitions

Wave definitions: Image credit NOAA

 Wave definitions: Image credit NOAA

wave crest is the highest point in the wave and a wave trough is the lowest point in the wave.

Wave height (H) is the vertical distance between the wave crest and the wave trough.

Wave length (L) is the distance from one crest to the next crest or from one trough to the next trough.

Wave period (T) is the time it takes successive wave crests or successive wave troughs to pass a fixed point. In the real world, the wave period is actually a spectrum of periods scattered about a mean wave period.

Wave steepness (S) is defined as wave height divided by wavelength (S = H/L). Therefore, the same wave height will result in high steepness if the wavelength becomes smaller. A small height divided by a large length will produce a low steepness. When the wave steepness exceeds about 1/7 the wave will begin to break or “white cap.”

Wave speed (C) is the speed an individual wave moves through water. If the wave period (T) and wave length (L) are known, then the wave speed (C) can be determined by C=L/T

Other Wave Facts:

Deep Water or Shallow Water
A wave is considered to be a deep water wave as long as water depth exceeds 1/2 the wavelength. A wave is considered to be a shallow water wave as long as water depth is less than 1/20 the wavelength. The area between deep and shallow water is transition zone.

Wave Energy
Wave energy increases by a factor of 4 as the wave height doubles so a 10ft wave is four times more powerful than a 5 ft. wave.

The significant wave height (Hs) is the mean height of the highest one third of the waves passing a point. This is of interest as this wave height correlates best with the wave height a trained observer reports after examining a group of wave heights from a ship or platform. The averaged periods of the waves used to compute significant wave height is known as the significant wave period.

Statistical distribution of wave heights

Statistical distribution of wave heights

Statistical distribution of wave heights

Useful wave height relationships:

Hm (Mean wave height) = 0.64 times Hs
Hs or H1/3 = Significant wave height
H1/10 (Highest 10% wave height) = 1.27Hs
H1/100 (Highest 1% wave height) = 1.67Hs
Hmax (Max probable wave height for a large sample) = about 2.0Hs

Ocean Swell is defined as any wave that has moved out of its wind generation source region. Swells characteristically exhibit smoother, more regular and uniform crests and a longer period than wind waves.

Combined Seas describes the combination or interaction of wind waves and swells in which the separate components are not distinguished. Combined Seas (CS) is the square root of the square of swell plus the square of wind waves: The National Weather Service considers the combined seas as being the same as significant wave height.

 A wall of water approaches the Stolt Surf in Oct. 1977 Photo: Karsten Peterse

A wall of water approaches the Stolt Surf in Oct. 1977 Photo: Karsten Petersen,www.global-mariner.com


Rogue waves

Rogue waves (sometimes called freak waves) are simply unusually large waves appearing in a set of smaller waves. A rogue wave will have a height of at least twice the size of surrounding waves, often come from a direction different than the prevailing waves, and they are unpredictable. Most reports of extreme storm waves say they look like “walls of water,” and are seen as steep-sided with unusually deep troughs. The USS Ramapo reported one such wave with a height of 112 feet in the Pacific in 1933.  Another report of a freak wave occurred when one struck the Queen Mary amidships, south of Newfoundland, at the end of World War II, rolling her to within a degree or two of capsizing.

References

The Weather Doctor, Keith C. Heidorn:”Weather Almanac for June 2004: SLOSHING THE LAKES: THE SEICHE

NOAA NWS JetStream – Online School for Weather: Wind, Swell and Rouge Waves

NOAA NWS JetStream – Online School for Weather: Tides

NOAA Ocean Service Education:  Tides and Water Levels

Sailor – Global Mariner Photos by Karsten Petersen

Wikipedia, the free encyclopedia: Rogue Wave

Posted in Meteorology, Weather Wisdom | Tagged , , , , , , , , | Leave a comment