High Wind and Wave Events Crossing the Gulf Stream

The Gulf Stream as per Ben Franklin

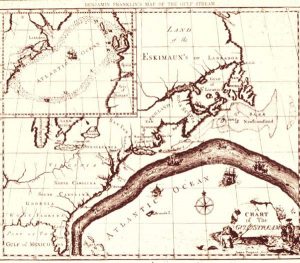
Benjamin Franklin provides a crude, but amazingly accurate rendition of the Gulf Stream for its time.

Crossing the Gulf Stream where ocean currents can exceed 2 knots takes some skill and if you try in under certain weather conditions, could be dangerous for any size vessel.  High wind and wave events can occur under certain conditions along the northern edge of warm, fast western boundary currents like the Gulf Stream off the US East Coast.  Other areas with similar conditions include the Kuroshio Current near Japan and Taiwan, near the Agulhas Current along the east coast of South Africa and the East Australian Current off east coast of Australia.

Boundary Currents Image

The figure above illustrates we global depiction of western boundary currents

There is also the Brazil Current, however, this major warm ocean current has not been a major part of commercial shipping traffic compared to the other currents which may explain why there have been no known major weather impacts reported.

The Gulf Stream

Benjamin Franklin, in 1786 noted that “vessels were “sometimes retarded and sometimes forwarded in their voyages by currents at sea”. He knew that ships coming from Falmouth to New York took a fortnight longer than those coming from London to Rhode Island. Franklin consulted a Nantucket sea captain regarding this and was told that the cause was the Gulf Stream. (Nantucket captains knew of the Gulf Stream because of the whaling trade.) That same captain marked the stream on a chart along with directions for avoiding it.

Temperature, Wind, and Waves: Its interaction with the Gulf Stream

During the winter months, when extremely cold air moves off the US East Coast and flows over the very warm waters of the Gulf Stream, unusually large waves can develop along the northern and western boundary of the stream. These events produce waves that are larger than one would expect for a given wind force and fetch. These conditions can present severe hazards to marine operations, especially to smaller vessels. In fact, there is documentation of waves being up to five (5) times the expected significant wave height values, as driven by higher winds. For example, gale force winds (34-47 knots) and higher, will generate, at a minimum, waves higher than 20 feet, and in addition, rogue waves have also been reported on occasion due to wave-current interactions.

The high winds associated with these cold air outbreaks arise from two factors:

  1. A decrease in friction as the wind moves offshore.
  2. Destabilization of the marine boundary layer (MBL) as cold air moves over warm water (especially, if there is a 20-degree difference in temperature (Fahrenheit) between air and the Gulf Stream surface.

During the winter, as arctic air moves offshore, the shallow cold air becomes unstable, especially over warm currents such as the Kuroshio of the Western North Pacific or the Gulf Stream of the Western North Atlantic.   The resulting strong vertical transfer of heat destabilizes and deepens the atmospheric boundary layer and the resulting de-stabilization allows high wind momentum to mix down to the surface. Ocean waves build quickly in response.

heat flux image

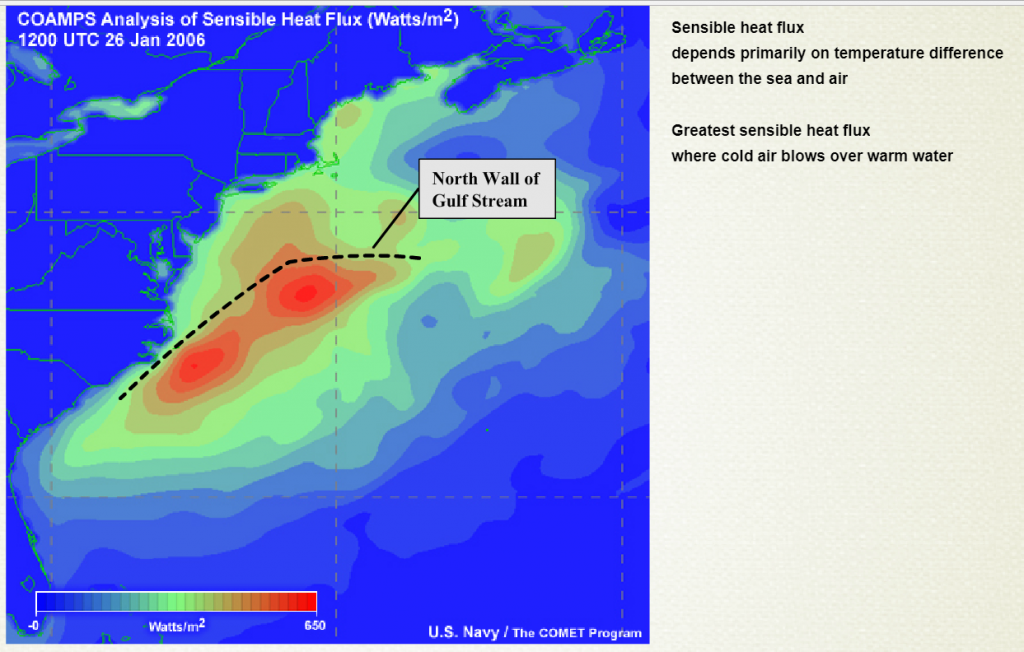
The COAMPS image above highlights the sensible temperature differential of Sensible Heat Flux with the ocean temperatures which becomes exacerbated with the infusion of cold air above.

Cold Air Over Warm Water

The illustration above depicts the stylized circulation in a shallow vertical scenario when cold air interacts with warmer ocean surface.

The synoptic situation for this scenario would be strong low pressure to the east of the Gulf Stream and high pressure to the west, setting up a NW wind flow which would cross the stream at a 90-degree angle to the NE set of the Gulf Stream (current’s direction of movement).  Another scenario is when wind opposes the current, especially in fall, winter and spring when we have strong temperature differences between the air above and the Gulf Stream below. Recent cruise ships have reported encountering winds of  up to 127 knots which was doubled what was forecast.

Satellite image showing cloud streets

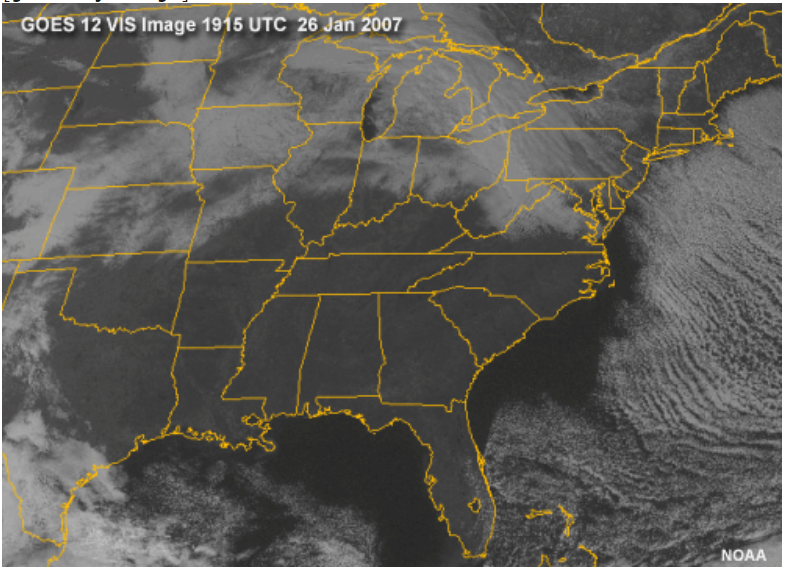
The GOES-12 visible picture above at 26/1915z shows a pronounced area of cloud free skies along the coast of VA-NC-SC associated with cold / dry air moving offshore from the NW. As the air moves further offshore, “clouds streets” begin to form, oriented parallel to the wind flow. Note the closeness of the clouds streets indicates the strength of the winds.

QuickSCAT image showing winds blowing counter to the Gulf Stream during September

To the right is a QuikSCAT image in  a September scenario that depicts enhancement of higher winds blowing counter to the Gulf Stream (from the NE) that is 15-20 knots outside of the Gulf Stream compared to 30-35 knots inside the stream).

The temperature differences are not as great as perhaps in the November through March months, when wind speeds can be significantly higher.

QuickScat image Jan

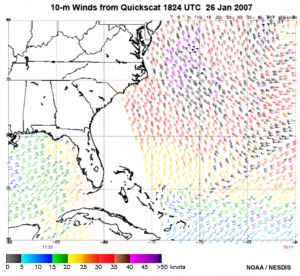
QuikSCAT image in January showing winds blowing across the Gulf Stream

To the left is a composite QuikSCAT imagery taken in January showing an area of strong winds exceeding 35 knots over and south of the North Wall of the Gulf Stream. (The highest reported wind was 55 knots.) The black barbs indicate areas of possible rain contamination. However, very little rain was noted in this area, but banded street clouds were observed.  It should be noted again in this scenario; the winds are blowing from the NW or at a perpendicular of 90-degree direction to the “set” of the Gulf Stream.

Waves Moving Against the Current

When ocean wind or swell waves encounter a current moving in the opposite direction, the response will be for wave speed and length to decrease, wave period will not change, but wave heights will increase, resulting in taller, steeper waves. In some cases, this can even lead to waves breaking, resulting in greater energy against hulls. This type of event can occur in all seasons and may or may not be associated with the cold air outbreaks mentioned above. The region around the Agulhas Current is particularly prone to high waves resulting from this type of wind opposing wave-current interaction.

When swell that originates elsewhere encounters a current, its wavelength and height change. When the current is flowing in the same direction as wave travel, wavelength increases while wave height decreases. Where currents oppose waves, wavelengths decrease, and wave heights increase. Ocean current eddies can cause large variations in the wave height and period, because they contain both counter currents and following currents with respect to the waves over relatively short distances.

Agulhas Current running against prevailing waves


The illustration to the left, is typical of the influence of the southern hemisphere’s roaring 40s and screaming  50s impact on the Agulhas Current.


NOAA thermal satellite image

The thermal satellite image to the right is a depiction of the Gulf Stream and its eddies allowing one to see the dramatic temperature contrasts in temperature between the continental shelf waters to the north and the adjoining Sargasso Sea to the south.  

Rogue Waves

Because waves slow when they encounter an opposing current, they also refract. Just as bends in the coastline concentrate or diffuse wave energy, bends and meanders in ocean currents similarly concentrate and diffuse wave energy. Wave refraction is one possible origin for rogue waves. Wave-current interactions increase exponentially as the current speed increases.  This effect becomes significant when currents reach speeds of 1-1.5 knots.

The figure below depicts two North Wall scenarios; wind against current and wind flow perpendicular to the axis of the Gulf Stream.

Two North Wall Scenarios


Mariner’s Weather Wisdom

When crossing a boundary current like the Gulf Stream mariners must be aware of the wind and sea forecast before departure and while underway.  If wind waves or swell are opposing the set of the current or if arctic air is streaming offshore at right angles to the current a mariner should anticipate a risk for encountering wave heights from 40% to 100% higher than the general forecast values near the north wall of the current and also crossing eddies.

Learn more about Ocean Waves here

Fred Pickhardt, chief meteorologist,
Ocean Weather Services
http://www.oceanweatherservices.com

Lee S. Chesneau
Lee Chesneau’s Marine Weather

If  you  are interested in in learning more about marine meteorology, weather forecasting, route planning and heavy weather avoidance through marine weather training  please let  us know here:


Posted in Meteorology, Weather Routing, Weather Wisdom | Tagged , , , , , , , , , | Leave a comment

Second Major Storm in a Week to Affect Atlantic Shipping

NOAA OPC Surface Analysis 1800 UTC 24 Feb 2018

A rapidly deepening major storm low is forecast to move southeastward from just south of Newfoundland Saturday to west-northwest of the Azores over the next 48 hours.  Winds are forecast to increase to 50-65 knots with seas building to 13 meters (42 feet) southwest of the center during the next 24 hours and 55-75 knots with seas to 15  meters (50 feet) west of the center within 48 hours.

NOAA OPC Surface Forcecast 1200UTC 26 Feb 2018

NOAA OPC Significant Wave Forecast for 1200UTC 26 Feb 2018

This will be a dangerous hurricane-force storm as it will  be moving through some of the main trans-Atlantic shipping lanes.

It  was less than  a week ago when another major  storm moved  through this part of the North Atlantic producing winds to 75 knots and seas to 19 meters (62 feet).    See  http://oceanweatherservices.com/blog/2018/02/20/north-atlantic-hurricane-force-storm-affecting-main-shipping-lanes/

Posted in Ocean Storms | Tagged , , , , | Leave a comment

North Atlantic Hurricane-Force Storm Affecting Main Shipping Lanes

NOAA OPC Surface Analysis 1200UTC 20 Feb 2018

An intense hurricane-force storm low over the central North Atlantic was producing significant wave heights of an incredible 19 meters (62 feet) today, according to the National Weather Service Ocean Prediction Center.

After dumping some moderate to heavy snow in the US Northeast, this low rapidly intensified overnight on Saturday, developing hurricane force winds in excess of 64 knots by Sunday morning.

A satellite pass showing a max significant wave height of 61.23 feet (18.7 meters) in the North Atlantic on Tuesday, February 20, 2018. Credit: NOAA

Extreme Wave Heights

The latest NOAA Ocean Prediction Center (OPC) analysis for 20th 12 00 UTC shows and extreme max significant wave height of nearly 19 meters. This storm could set a new record for this part of the Atlantic.

Note: Significant wave height is the average height of the tallest one-third of waves (from trough to crest), so individual waves are likely to be much, much bigger.

Danger to Shipping

This storm poses an extreme danger to maritime shipping as it has tracked eastward at a fairly low latitude over some of the main shipping channels connecting North Europe and Mediterranean ports and US East Coast and Gulf ports.

The good news, however, is this monster is forecast to weaken rapidly over the next 24 hours.

Learn more about these wintertime hurricane-force storms

Learn more about ocean waves

Posted in Ocean Storms, Weather History | Tagged , , , , | Leave a comment

Dangerous North Atlantic Storm Impacting Shipping Lanes

NOAA OPC Surface Analysis 1200UTC 19 Feb 2018

A developing hurricane force storm low over the west-central North Atlantic continues to move eastward at 35 knots producing winds of 55-75 knots with significant wave heights up to 12 meters (40 feet) within 180 NM south and 120 NM west of the center. Over the next 24 hours max winds will be between 50-75 knots with significant wave heights to  15 meters (50 feet)  within 240 NM in the western semi-circle.

This is a dangerous storm as it is tracking eastward at a fairly low latitude and is affecting shipping from North Europe and Mediterranean ports and US  East Coast and Gulf ports.

NOAA OPC Significant Wave Forecast 0000UTC 20 Feb 2018

NOAA OPC Surface Forecast 0000UTC 20 Feb 2018

Learn  more about hurricane-force winter storms here

Posted in Ocean Storms | Tagged , , | Leave a comment

What does a Small Craft Advisory mean?

The National Weather Service has developed a multi-tier concept for forecasting hazardous weather which includes outlooks, watches, warnings and advisories.

Make sure you recognize the visual day flag and nighttime light signals that warn you of rough weather.

An outlook is issued to indicate that a hazardous weather or hydrologic event may occur over the next several days.

A watch is issued whenever that risk has increased significantly but the occurrence, location or timing are still uncertain. Marine Watches for “GALE” “STORM”, and “HURRICANE FORCE” wind conditions, not related to tropical cyclones, can be highlighted in extended range forecasts beyond 24-hours for coastal inland waters, and offshore waters (does not include high seas forecasts).

A warning is issued when the hazardous condition or event is either occurring, imminent or likely (for the marine forecasts, within 24-hours).

A weather advisory is issued when a hazardous weather condition or event is occurring, imminent or likely but for less serious conditions than those that would warrant a warning.

A small craft advisory (SCA) is issued by the National Weather Service whenever conditions in the coastal waters or Great Lakes meet specific thresholds that are defined locally and can include wind, waves and sometimes ice. This is issued within 24-hours of expected small craft advisory conditions.

It is important to note that there is NO precise definition of “small craft” and the interpretation is left to the vessel operator. This might include considerations of the operator’s experience level, vessel type, overall size and sea worthiness.

Small Craft Advisories are normally issued for sustained winds or frequent gusts between 20 and 33 knots except that the minimum wind criteria may be as high as 25 knots and as ow as 18 knots, depending on local criteria. Minimum wave heights for a Small Craft Advisory also vary regionally from as little as 5 feet to as much as 10 feet, also depending on local criteria considerations.

Small Craft Advisories can also be issued for winds and waves below the local minimum criteria if hazardous sea conditions exist due to wave period, wave steepness, swell direction or ice. In addition, in or near bars (e.g. Grays and Columba River), advisories might also be issued due to the interaction of swell and currents in shallow water interacting with ebb tides.

Fred Pickhardt, chief meteorologist,
Ocean Weather Services
http://www.oceanweatherservices.com

Lee S. Chesneau
Lee Chesneau’s Marine Weather
http://www.marineweatherbylee.com

Posted in Meteorology, Weather Wisdom | Tagged , , , | Leave a comment

Update: Dangerous North Atlantic Hurricane Force Storm Expected

NOAA OPC Surface Forecast Chart for 1800 UTC 18 Feb. 2018

Atlantic Storm Update

A rapidly deepening storm low is forecast off the USEC Sunday morning then tracks ENE to East with winds reaching 55-70 knots and seas to 10 meters (33 feet) by 1800 UTC 18th and winds off 60-75 knots and seas to 16 meters (52 feet) possible by 0000 UTC 20th over the Central North Atlantic.

Shipping Threat

The forecast for a relatively southerly storm track will cause issues for ship traffic between North Europe and Mediterranean ports to US East and Gulf Coast ports.  This system should be considered a dangerous storm.

NOAA OPC Significant Wave Forcecast 20th 0000UTC

For more information about storms like this, please read “The Other Hurricane Season”

Posted in Ocean Storms | Tagged , , , | Leave a comment

Hurricane Force Storm Forecast for Central North Atlantic

NOAA OPC Surface Forecast chart

A weak low will move off the USEC near Cape Hatteras Saturday evening then move eastward and deepen rapidly and develop storm to hurricane force winds of 55-70 knots and seas to 9 meters (30 ft) south and southwest of the center by 1800UTC 18 February.  As the storm moves east seas will continue to build up to 14 meters (46 ft) by 1200 UTC 20th.

Shipping Danger

This fast moving system will be a danger to shipping lanes from North Europe to US south of Hatteras and from the Gibraltar to US East and Gulf Coast Ports as highest winds and waves will prevail between 35N and 43N latitudes in the central North Atlantic.

NOAA OPC Surface Forecast

NOAA OPC Significant Wave Height Forecast

Posted in Ocean Storms, Weather Routing | Tagged , , , , | Leave a comment

Tropical Cyclone Cebile near peak intensity

JTWC forecast track

Tropical Cyclone Cebile located about 583 NM S-SE of Diego Garcia in the southern Indian Ocean is packing winds to 115 knots with max significant wave heights to 34 feet (10.4 meters). Hurricane force winds extend outward 50 NM to the southeast and 35 NM to the north. Cebile is moving slowly towards the west-northwest at 4 knots.


Cebile is forecast to gradually weaken over the next few days at it turns more towards the south then southeast.

Multi-spectral Satellite image TC Cebile

Posted in Ocean Storms, Tropical Cyclones | Tagged , , , | Leave a comment

Dangerous Hurricane-force storm forecast off Japan

NOAA OPC Forecast for 1200 UTC 23 January 2017

A rapidly developing hurricane-force storm low is forecast over the western North Pacific off the coast of Japan January 22nd-23rd with storm to hurricane force winds and significant wave heights to 17 meters (about 56 Feet). This will be a dangerous storm affecting ships arriving and departing Japan.

The highest significant wave height ever recorded was a massive 19 meters (62.3 feet!) measured by a buoy in the North Atlantic.

Wave Relationships

Hs or H1/3 = Significant wave height (average of the highest 1/3 waves)
H1/10 (Highest 10% wave height) = 1.27 x Hs
H1/100 (Highest 1% wave height) = 1.67 x Hs

Read more about ocean waves here 

Read more about Hurricane-force extra-tropical storms here

NOAA Significant Wave Forecast 1200 UTC Jan 23rd.

Posted in Ocean Storms | Tagged , , , , | Leave a comment

Hurricane-Force Storm off US East Coast

NOAA NWS 1200 UTC Surface Analysis 04 Jan 2018

A rapidly deepening and dangerous hurricane-force storm off the US East Coast is moving northeastward at 30 knots.  Winds of 60-80 knots (70-90 mph) and seas to 49 feet (about 15 meters) are expected  during the next 12 hours within 180 nm south of the center.

The central pressure in this storm has fallen about 54 mb over the past 24 hours, so it easily qualifies as a meteorological “bomb” (an official term for an extratropical cyclone with a pressure drop of at least 24  mb in a 24 hr time period).

This storm will adversely affect shipping along  the US East Coast into Friday.  In addition to the high winds and waves, heavy snow is occurring from New York City Northeastward to Maine.


Well Forecast

NOAA OPC 96 hour forecast issued New Years Eve for Jan 4th

As far back as New Year’s eve NOAA was predicting a rapidly deepening hurricane-force storm off the US East Coast for the 4th so this one was no surprise!

The Other Hurricane Season

This type of storm is not as rare a most think. Few people (outside of Mariners) realize that there is another season of hurricane winds that occur each year over both the Atlantic and the Pacific that runs from September to May.   The current storm off the East Cost is a good example.


Read more about this type of storm here.

Check out NOAA Satellite loop here.

NOAA Visible Satellite Image 1345 UTC 4 Jan 2018

NOAA OPC Surface Forecast 0000 UTC 5 Jan 2018

NOAA OPC Wave Forecast 0000 UTC 5 Jan 2018

Posted in Ocean Storms | Tagged , , , | Leave a comment