Planning a Caribbean Cruise in March?
What to Expect


December marks the beginning of the dry season in the Caribbean, making it a popular time to trade cold weather for warm sun and clear waters. Generally, you can expect pleasant conditions, with low humidity, comfortable temperatures, and a very low risk of tropical storms. 
Here is a detailed breakdown of the wind, wave, temperature, and rainfall conditions for a December cruise.
Fred Pickhardt
Marine Meteorologist

In complex maritime disputes, the weather is rarely just a circumstance; it is often a central piece of evidence. Whether your case involves cargo damage, vessel loss, or crew injury, understanding the precise marine conditions is essential for building a winning legal strategy. A detailed forensic marine weather analysis can make the difference between a successful resolution and an unfavorable one.
Uncovering the Truth in High-Stakes Maritime Cases
When millions of dollars are at stake, assumptions based on a ship’s log or news reports are not enough. Admiralty law firms need an objective, scientifically sound reconstruction of events to determine what actually happened. A forensic marine meteorologist can provide this by:
Expert Testimony that Strengthens Your Position: A Case in Point
The value of an expert opinion comes from its ability to stand up to scrutiny in court. A skilled forensic meteorologist can provide clear, logical testimony that supports your case, as demonstrated in this real-world example:
In July 2008, a cargo vessel sustained significant damage while transiting the northern Arabian Sea. The cargo interests claimed the weather conditions were “normal and expected” for the monsoon season and that the vessel operator was negligent. The initial weather report presented by the opposing side supported this claim, concluding that winds were moderate and wave heights were within the expected range for the area in July.

Ocean Weather Services was retained to provide a deeper analysis. We quickly discovered that the initial report relied primarily on broad output from weather forecast models, neglecting actual observations. By incorporating actual data from nearby ships and buoys—information missing from the opposing report—our analysis revealed a different story. The empirical evidence showed winds significantly higher than previously reported, reaching Beaufort Force 9 (41-47 knots), and waves up to 8 meters.
This critical evidence, overlooked by the other party’s analysis, allowed us to contradict their claims and establish how specific, severe weather conditions were a contributing factor to the incident. This level of factual, evidence-based testimony can decisively strengthen a law firm’s position.
Beyond the Courtroom: Your Strategic Weather Partner
The role of a forensic marine expert isn’t limited to litigation. Admiralty law firms can also leverage this expertise for:
By partnering with a forensic marine weather expert, your firm gains a powerful ally capable of translating complex atmospheric and oceanographic data into a clear, evidence-based narrative.
To discuss how our services can strengthen your next maritime case, contact us today.
Contact: Ocean Weather Services
The air hung heavy and still on the morning of Saturday, September 23, 1848, a stillness that felt less like peace and more like a held breath. The few hundred residents of the tiny village of Tampa and the soldiers stationed at Fort Brooke, surrounded by a largely unsettled Florida wilderness, had no modern warnings. The only signals were the phosphorescent glow that lit up the bay that night and an ominous, oppressive sultriness.

For some, an unease set in. Folks who had traveled into the post from the countryside cut their errands short, rushing home with a sense of foreboding. By Sunday, the winds began to gust, and the first showers started to fall. The tide, which would soon become a nightmare, was just beginning its treacherous rise.
The keeper’s gamble
At the mouth of Tampa Bay, on Egmont Key, stood the newly completed lighthouse. Its keeper, Sherrod Edwards, was a seasoned man of the sea, but nothing could have prepared him for what was coming. On Sunday morning, he watched the tide swell with alarming speed. Within minutes, two feet of saltwater surrounded his home. He had to think fast, with his family’s lives hanging in the balance.

Edwards loaded his family into his boat and, wading through the rising water, tied the vessel to the strongest palmetto trees he could find at the highest point of the tiny island. For hours, they swayed and bobbed in the violent winds, clinging to a boat tethered to trees. The next day, after the worst of the gale had passed, they found the boat—still intact, but lodged high in the treetops.

Tampa’s last stand
In the heart of the storm, as the winds screamed and the bay became a monstrous, churning beast, the residents of Fort Brooke faced annihilation. The barometer, a marvel of 19th-century technology, plunged to a terrifying 28.18 inches (954 mb). The military post’s surgeon later wrote that the water had risen an astonishing 15 feet above low tide.

Young Juliet Axtell, the chaplain’s wife, wrote in a letter that Tampa “was no more.” Her words were not an exaggeration. The storm surge swallowed Fort Brooke, battering and ultimately destroying the barracks, the church on the beach, and the Indian agent’s office. The garrison and its dependents had retreated to higher ground, but they were nearly submerged. One observer wrote that the only things visible were the very tops of the trees.
When the sun finally rose on Tuesday, September 26, the silence was as unnerving as the storm’s roar had been. In the town, only five buildings were left standing, and every one of them was damaged. Every ship in the port had been torn from its moorings and driven upriver, smashed to pieces.
A changed landscape
The Great Gale of 1848 didn’t just break man-made structures; it rewrote the map of Florida’s west coast.
Today, the modern city of Tampa, with its high-rises and robust infrastructure, seems a world away from the vulnerable outpost of 1848. The story of the Great Gale is a stark and chilling reminder that the bay’s tranquil waters hold a terrifying power, a lesson etched into the very coastline by the “granddaddy of all hurricanes”.
About: Ocean Weather Services
As of late May, sea surface temperatures (SST) are cooler than normal over most of the eastern half of the Atlantic Main Development Region (MDR) while they remain warmer than normal over the southwestern North Atlantic, Caribbean, and Gulf. This is in contrast to 2024, when most of the Atlantic was warmer than normal.
As a result, this year’s outlook has a much higher degree of uncertainty which is apparent in the large range of storm predictions from various forecast centers. Forecasts for the total number of named tropical cyclones for this year range from as little as 10 to as much as 19 with 5-10 expected to reach hurricane strength and 2-6 becoming major hurricanes. The average season will produce 14 named storms, 7 hurricanes, and 3 major hurricanes. During 2024, there were 18 named systems with 11 becoming hurricanes and 5 major hurricanes.

Uncertainty
One factor causing uncertainty is that the La Nina (which favored storm development in 2024) has ended and the tropical East Pacific conditions are forecast to be neutral through the peak of the 2025 season. Another factor is that since mid-winter, there has been a significant cooling of the eastern North Atlantic sea surface temperatures. Early in the season, tropical storms tend to develop over the western Caribbean and southwestern Atlantic where SST remains warm, however, the MDR is the primary location for hurricanes that threaten the U.S. and Caribbean during the peak of hurricane season and is now markedly cooler than last year.

2025 Hurricane Outlook
Model outlooks for the peak of the hurricane season, however, suggest that, overall, the sea surface temperatures will be somewhat warmer than normal. Models also suggest that somewhat below normal rainfall is expected during the peak season this year for the Caribbean Sea with near normal rainfall rates elsewhere, except, wetter than normal conditions over the Atlantic off the Southeast US Coast.

Yet another factor in hurricane development is wind shear, with the NOAA Climate Forecast System (CFS) is forecasting near normal wind shear, while the NNME predicts below normal wind shear. Wind shear tends to tear developing tropical cyclones apart, so a low wind shear environment would support a more active season.

Averaging the various available forecasts suggests that the 2025 Hurricane season will be near normal, perhaps slightly more active than normal with 14-15 named storms, with 7-8 becoming hurricanes and 3-4 major hurricanes.


Image Source Tropicaltidbits.com
Fred Pickhardt
Meteorologist
Ocean Weather Services

Hurricane Milton 2024
As of April, conditions in the North Atlantic appear to favor a somewhat more active season than normal, however, less active than in 2024. Several hurricane outlooks have already been published, predicting between 10 and 18 named storms with 5-10 becoming hurricanes and 2-6 becoming major hurricanes. The normal season will produce 14 named storms, 7 hurricanes, and 3 major hurricanes.
One factor is that La Nina (which favors storm development) has ended, and the tropical East Pacific conditions are forecast to be neutral during the peak of the 2025 season.
In addition, Sea Surface Temperatures (SST) remain warmer than normal over the western portions of the Atlantic and Caribbean, however, a significant cooling trend has developed since January over the eastern portion of the Main Development Region (MDR) and has slowly spread westward. Early in the seasons tropical storms tend to develop over the western Caribbean and southwestern Atlantic, however, the MDR is the primary location for hurricanes that threaten the U.S. and Caribbean during the peak of hurricane season.
.

Early Hurricane Outlooks
FORECAST Named Storms Hurricanes Major Hurricanes
Colorado State University 17 9 4
AccuWeather 13-18 7-10 3-6
WeatherBell 10-14 5-7 2-3
Fox Weather Analogs 14.8 8.6 3.2
TSR 15 7 3
Mean 15 8 3
2024 Season 18 11 5
Normal 14 7 3
The North American Multi-Model Ensemble (NMME) is a seasonal forecasting system that consists of multiple coupled models from North American modeling centers.
Based on the closest SST anomaly analog years (2013, 1970, 1967, 2000, and 2011), the 2025 hurricane season may see many storm tracks remaining over the Atlantic. Highest probability of impacts may be in the northern and eastern Caribbean to the Bahamas as well as the northwestern Caribbean and southern Gulf.

Fred Pickhardt,
Ocean Weather Services
By the second week of January a strong 500 mb ridge had already set-up over the eastern North Pacific blocking the normal west to east storm tracks into the western US. NOAA models were predicting that the ridge would hold through at least the third week of January as a deep trough was expected to prevail over east-central North America. This winter pattern is ideal for allowing very cold Arctic air masses to move rapidly southward across western Canada and into the central and eastern US. and models were predicting very cold air to prevail, especially during the 2nd half of January.
A particularly strong Arctic High was forecast to plunge southward out of Canada and over much of the US during the weekend of January 18th and 19th through much of the following week.
By January 17th NOAA was predicting that a low pressure disturbance was forecast to form over the Gulf of Mexico and move eastward towards Florida bringing significant snow and ice to portions of the deep south, including northern Florida the following Tuesday and Wednesday. NOAA NWS offices started to issue warnings for bitter cold advising to expect the coldest air of the season.
Advisories were issued for bitterly cold arctic air and a wintry mix of snow, sleet and freezing rain overspreading south-central Texas to the central Gulf Coast during Monday night. Snow or a snow, sleet, freezing rain mix was forecast for cities from San Antonio to Houston and New Orleans to Albany, GA while freezing rain was expected to fall on South Texas and portions of southern Georgia and northern Florida as the winter storm tracked Tuesday/Tuesday night.
By Tuesday, January 21st, a strong jet stream was funneling Arctic air directly over the South where it interacted with warm moist air over the Gulf. An area of low pressure developed over the western Gulf by early on the 21st moving east to east-southeast to the Florida Straits by early the next day.
A band of heavy snow moved from Texas across Louisiana to the Florida Pandle and into southern Georgia. Snowfall totals tied a 130-year-old record in New Orleans, measuring 10 inches. 6-13 inches of snow were deposited across much of southern Louisiana. In Alabama, Mobile Regional Airport set a new 2-day snowfall record with an impressive 7.5 inches which surpassed the previous 2-day record of 6.0 inches of snow in February of 1895.
Pensacola, FL, shattered its previous 2-day snowfall record with an incredible 8.9 inches of snow which blew away the prior 2-day record of 3.0 inches during the February Snowstorm of 1895. This snowstorm also surpassed the snow and ice accumulations from the historic 2014 event.
NOAA Storm Summary https://www.weather.gov/mob/2025_January_Snow
When weather events at sea cause damage to ships and cargo or injure crew members, just how do you determine what happened? All ship masters make frequent log entries regarding the ship’s position, vessel condition, fuel and water reserves, as well as the weather encountered. When tens of thousands to millions of dollars are at stake, the various parties involved in a marine venture need to know what actual weather conditions were encountered. This is when a forensic marine weather expert can be employed to make an independent assessment.
In July of 2008, a cargo vessel was transiting the northern Arabian Sea, east of Socotra Island, and allegedly sustained significant cargo damage due to bad weather conditions. The cargo interests in the venture, however, claimed that the weather encountered was “normal and expected” for the summer monsoon season and that the vessel operator was negligent in conducting proper ship handling and navigation. The month of July is well-known for rough weather conditions in this area of the Arabian Sea due to persistent southwesterly monsoon winds. To that end, they presented a forensic weather analysis as evidence.
Ocean Weather Services was asked to review the weather analysis report that was presented by the weather consulting company. This report claimed that wind conditions were from the southwest between Beaufort forces 6 and 7 (22-32 knots) and produced waves in the range of 4 to 5.5 meters which normally occurs in this area during July. The report concluded that winds of Beaufort Force 9 (41-47 knots) with waves up to 8 meters did not occur as was reported by the master of the vessel.
The Review
Our review of the report showed that the conclusions regarding wind and wave conditions were based primarily on output from 3 US weather computer forecast models and from derived surface winds from the NOAA Satellite data. What was not included in the report were any actual weather observations from buoys or other ships in the same area at that time.
The most accurate source of surface marine weather data are instrumented weather buoys. From our research, we discovered that there were no such buoys near the location of the incident, so to establish the prevailing wind and sea conditions, other direct observations, such as ship weather reports, were considered along with any pertinent computer weather model data.
Ship observations are usually taken by experienced mariners with wind speed and direction either measured directly with allowances made for ship motion or by estimating those conditions by viewing the sea state. Wave observations taken from onboard ships are, for the most part, estimated by observing the sea state. Ship observations are, however, actual observations and are an essential source of information to be considered along with other data sources.
Since the significant wave height represents the average of the 1/3 highest waves, then some waves will be higher. Based on past statistical studies, a significant wave height of 6 meters means that, on average, about 1 in 10 waves will reach a height of about 7-8 meters, and about 1 wave in 100 will reach a height of about 10 meters.
It was the opinion of Ocean Weather Services that the vessel did encounter winds up to Beaufort force 9 (41-47 knots) and highly likely encountered some waves in the range of 7 to 10 meters. In addition, over open ocean, wind gusts can briefly exceed the reported wind speed by 20-25 percent, and in rare cases, up to 40 percent.
Fred Pickhardt
Ocean Weather Services
The 2024 Hurricane Season is predicted to be well above normal due to two primary factors: El Nino and warm ocean water.
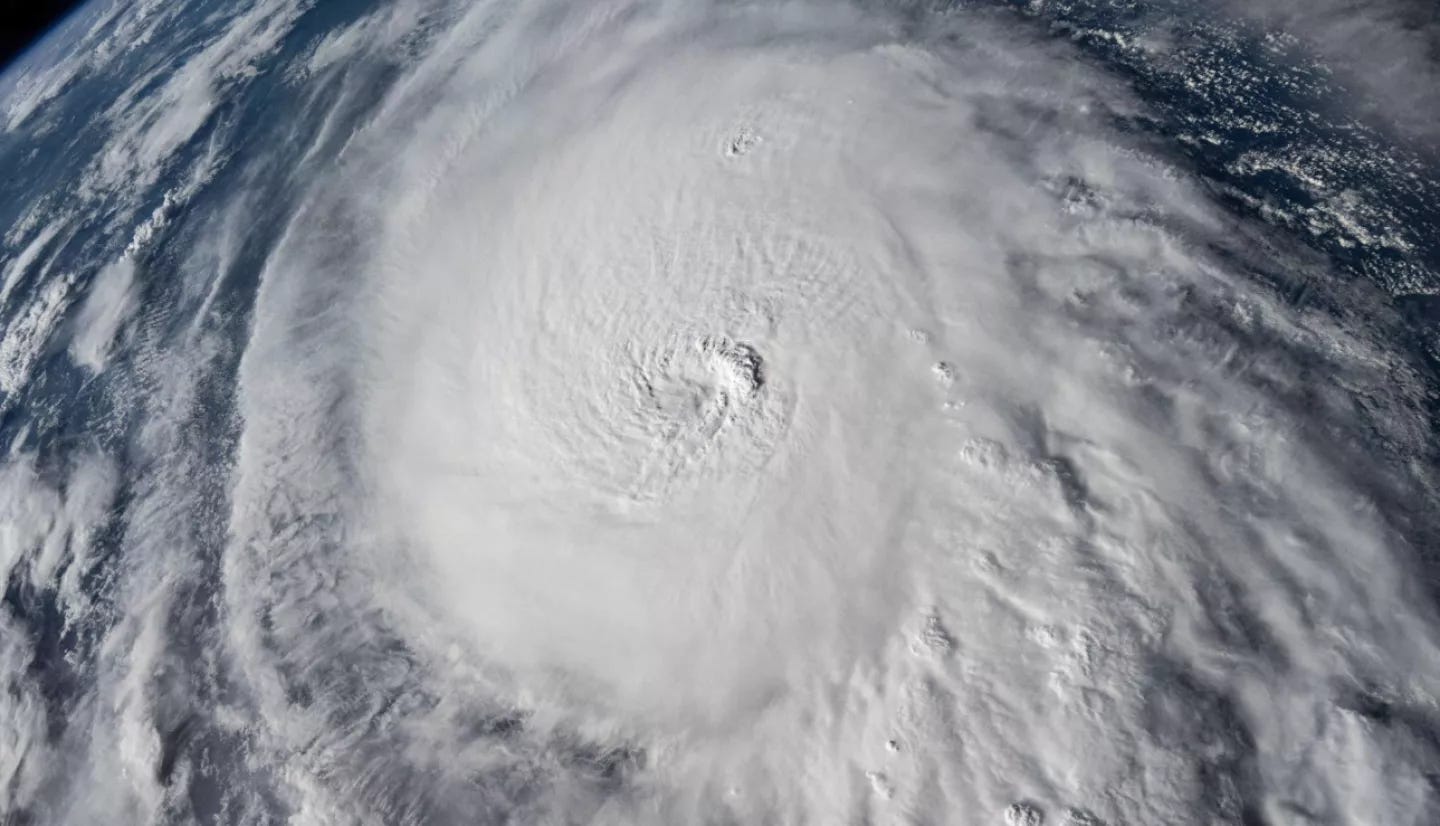
On average, a tropical storm will pass within 50 miles of Tampa Bay about once every other year, while hurricanes pass within 50 miles about once every 4 years and major hurricanes, about once every decade. Direct major hurricane hits on Tampa Bay are rare, with only 2 ever recorded; a Cat 4 storm in 1848 and a Cat 3 storm in 1921.
A 2010 study called “Project Phoenix”, funded by FEMA, took a look at the Tampa Bay area if it was directly hit by a Cat 5 hurricane. In this “worst case” scenario, power outages would be widespread with all of Pinellas County being without power and with Pasco and Hillsborough Counties experiencing nearly total power outages as well. The associated storm surge would be as high as 26 feet in Tampa, 24 feet in Apollo Beach, and 20 feet in St. Petersburg.
All told, a Cat 5 storm could result in up to 2,000 people dead, 2 million injured, and almost 500,000 homes and businesses destroyed. All three bridges between Tampa Bay and the Courtney Campbell Causeway would “sustain either structural damage or have their approaches washed away by water and waves.”
It is not all bad news for this season, however. Although there is an overall higher risk for tropical cyclone activity in the North Atlantic this season, perhaps even setting records, the risk for a hurricane directly hitting the Tampa Bay area may actually be no greater than average, and possibly slightly less than average.
Based on analysis from Colorado State University, the risk for a named tropical storm passing within 50 miles of Pinellas County this year is about 64% which is 10% higher than the long-term (1880-2020) average of 54%. The risk for a hurricane passing within 50 miles of the coast, however, this season is 26% which is actually slightly lower than the long-term average of 27%. The risk for a major hurricane (Cat 3-5) passing within 50 miles of the coast this year is 10%, also slightly below the long-term average of 11%.
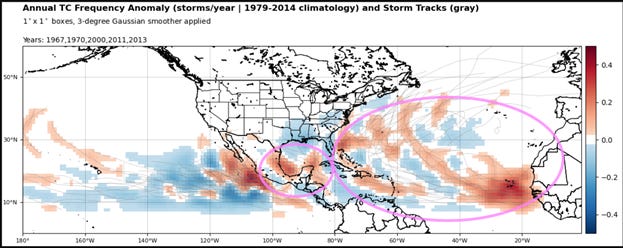
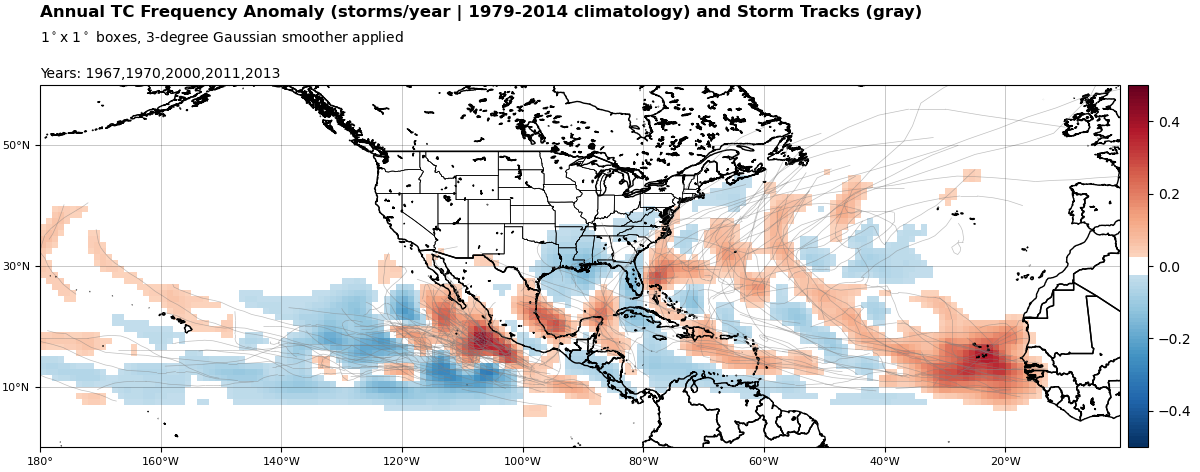
The North American Multi-Model Ensemble (NMME) is a seasonal prediction system that combines data from computer climate models in the U.S. and Canada to produce monthly and three-month averages. The NMME has been releasing global forecasts every month since 2011, and its information is used by NOAA to inform their seasonal outlooks.
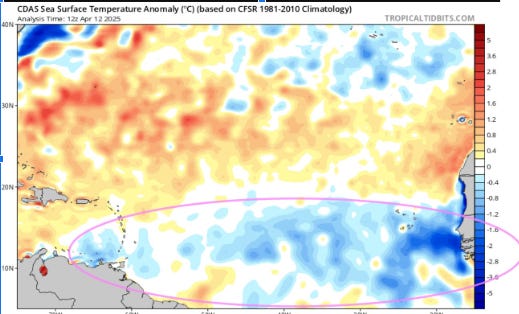
The best analog years for the 2024 hurricane season based on NMME sea surface temperature anomalies are 1970, 1999, 2007, 2010, and 2011. The resulting outlook suggests hurricane tracks are more likely in the red-shaded areas vs. blue-shaded areas. Most of Florida is in the blue zone, except for extreme South Florida and the Keys.
Source: Tropical Tidbits.com

With hurricanes, size does matter. Typically, for a Cat 1 hurricane, the radius of hurricane force winds will extend out only about 25 miles, with only about 10% of storms being large enough to have hurricane force winds out to over 45 miles. Major hurricanes tend to be larger, with hurricane force winds extending outward about 45 miles, on average, with a few extending outward some 75 miles or more. Damaging winds of 50-64 kt (58-73 mph) usually extend out farther, typically to about 80-110 miles from the center and often cause roof damage, uprooted trees, and significant power outages.
A recent NOAA NHC blog details size differences in 2 major hurricanes:
Why Tropical Cyclone Size Matters: A Comparison of Hurricanes Charley (2004) & Ian (2022)
Tropical cyclone winds over land are reduced due to land friction by 20% to 50%, however, gustiness will increase from about 10% over water to 20-30% over land. For example, a wind of 80 mph over the ocean would be reduced to about 64 mph over the immediate coastal beaches and to 40-50 mph farther inland. Wind gusts, however, still could reach 75-80 mph along the beaches and 55-65 mph farther inland.
Peak winds over land often are significantly less than the “max winds” reported in a hurricane, especially when the center passes to the east of our area. Even storms passing to the west, like Hurricane Gladys in 1968, will have winds reduced over land. The key issue is whether the center passes east or west of Tampa Bay and how far-out hurricane-force winds extend at that time.
Some examples of hurricanes passing near Tampa
The October 25, 1921 Tampa Bay hurricane had a peak wind of 125 mph at landfall near Tarpon Springs, just 25 miles northwest of Tampa. In Tampa, however, a peak wind of 68 mph with a gust to 75 mph recorded atop a tall building in downtown Tampa. The adjusted surface peak wind was later estimated to have been 56 mph. Most of the damage done by this storm in Tampa and St. Petersburg was due to the storm surge. The 10.5 foot storm surge in Tampa Bay was the highest since the Great Gale of 1848.
In October of 1944, a hurricane with max winds of about 95 mph passed just 15 miles southeast of downtown Tampa. The maximum sustained wind reported at Tampa was 66 mph.
In September of 1960, Hurricane Donna passed about 38 miles east of downtown Tampa with max winds about 92 mph. The highest sustained wind reported at Tampa was 62 mph with a gust to 75 mph.
In October 1968, Hurricane Gladys passed about 40 miles northwest of Tampa with max winds of 100 mph, in Tampa the max wind was 37 mph.
More recently, Hurricane Charley passed about 45 miles southeast of Tampa with max winds of 115 mph while the highest wind reported at Tampa was 23 mph with a gust to 30 mph.
The National Hurricane Center’s average track forecast error has improved significantly over time, however, even today the average error just 48 hours out is about 50 nm (58 statute miles) which is close to the average extent of hurricane force winds for major hurricanes. This, unfortunately, makes it difficult to predict where the major impact will occur.
NOAA NHC Track Forecast Error over Time
In most cases, it is the storm surge that does most of the damage in a hurricane. Water (due to flooding by storm surge or heavy rainfall) is the number one killer during a hurricane or tropical storm in the U.S., accounting for nearly 90% of all tropical cyclone deaths. If you are in an evacuation zone, it is imperative to monitor local evacuation zone messages as a storm approaches.
Tampa Bay Evacuation Zones
Fred Pickhardt
Meteorologist
Ocean Weather Services
Now that the hurricane season is approaching, here are my thoughts on the best tropical cyclone tracking sites:

A view of Hurricane Florence is shown churning in the Atlantic Ocean in a west, north-westerly direction heading for the eastern coastline of the United States, taken by cameras outside the International Space Station, September 12, 2018. NASA/Handout