

Developing Hurricane Force Storm Low
1800UTZ 18 Dec: A rapidly deepening storm over the northwestern North Atlantic will produce storm to hurricane force winds (55-75 knots) with seas 27-40 feet (8-12 meters) during the next 18-36 hours.
Developing Hurricane Force Storm Low
1800UTZ 18 Dec: A rapidly deepening storm over the northwestern North Atlantic will produce storm to hurricane force winds (55-75 knots) with seas 27-40 feet (8-12 meters) during the next 18-36 hours.

1200Z NOAA OPC Surface Analysis
Dec. 15th 2016 1200UTC: An intense 949 MB hurricane force storm low over the Western North Pacific is moving northeastward towards the Bering Sea with winds of 50-70 knots and seas 30-50 feet (about 9-15 meters).
 A rapidly intensifying storm low is forecast over the Central and Eastern North Pacific within 48 hours with winds of 50-70 knots and significant wave heights up to 36 feet (11 meters) within 180 NM south and southwest of the center. In 72 hours forecast minimum pressure is 945 mb.

Typhoon Meari IR Photo via NOAA
1800UTC 4 Nov. 2016: TS Meari has been upgraded to a typhoon over the western North Pacific about 493 NM south of Iwo To with max winds of 65 knots. Hurricane force winds extend outward 55 NM to the northeast and 25 NM to the southwest. The center was moving towards the N-NE at about 8 knots. Maximum significant wave height is estimated at about 22 feet (6.7 meters). Meari is forecast to continue moving towards the northeast peaking at 100-110 knot winds in about 48 hours.

JTWC forecast chart Typhoon Meari
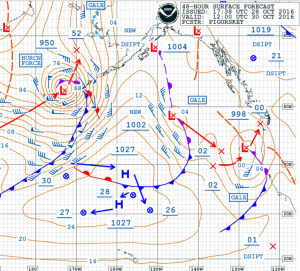
NOAA OPC Surface forecast for 1200 UTC 30 October 2016
A rapidly deepening storm low is forecast over the central North Pacific during the next 36-48 hours. By 1200 UTC 30 October the low is forecast to be 950 MB moving across the Aleutians into the Bering Sea with winds 50-75 knots and significant wave heights 27-44 feet (8-13.5 meters) within 180 NM south of the center.
Learn more about “The Other Hurricane Season”

Surface weather analysis of the sixth hurricane of the 1921 Atlantic hurricane season on October 24, 1921.
One of the most significant hurricanes to hit Tampa occurred on October 25th of 1921. The first recorded major hurricane to hit Tampa occurred in September of 1848.
The Chief Hydrographer at the Panama Canal may have reported the first indication of a developing disturbance over the Caribbean Sea between October 13th and 18thwhen the barometer fell steadily and winds prevailed out of the north with frequent heavy rains, particularly on the Pacific side of the Canal Zone. Suddenly, on Oct. 18th, the winds reversed and blew steadily from the south ending the rain. The wind also picked up after the 18th, averaging nearly 20 mph between the 20th and the 22nd with a peak 5-minute wind speed of 35 mph.
On October 21st the first indications of disturbance was reported by other Caribbean stations and a few weather-reporting ships over the Caribbean sea which caused the US Weather Bureau to issue its first advisory at 10 am that day: ”A disturbance appears to be forming over the western Caribbean Sea southwest of Jamaica; movement uncertain, but probably northward”
The developing disturbance moved north-northwest from the Southwestern Caribbean Sea passing near Swan Island on the 22nd where the barometer dropped to 29.20 inches (989mb) between 10 am and Noon. The wind, which had been blowing out of the north across the island, shifted to the south-southwest and reached a peak velocity of 80 mph (70 knots). A hurricane had indeed been born!
By October 23rd the hurricane moved through the Yucatan Channel where the schooner Virginiareported a minimum pressure of 27.80 (941mb) as it entered the eye of what was now a category 4 hurricane. The next day the SS El Estero at latitude 25-36N longitude 84-24W encountered the eye of the hurricane at about 10 pm as the barometer reached a minimum of 27.84 inches (943mb). At noon that same day, a Hurricane Warning was issued for the West Coast of Florida from Key West to Apalachicola.
During the night of the 24th and the morning of the 25th the hurricane turned toward the north-northeast then later northeast finally making landfall near Tarpon Springs, Florida where a minimum barometer reading of 28.12 inches (952mb) was recorded at about 2:15 PM that same afternoon. This reading suggests that a max wind at landfall of about 110 knots (125mph) which would make this storm a Cat 3 hurricane. After landfall, the storm tracked east-northeast across Florida exiting near Daytona Beach early on the 26th as a Cat.1 hurricane.
The US Weather Bureau office in Tampa reported a storm surge of 10.5 feet above mean low water at about 2 PM EST on the 25th and a rainfall total of over 8.5 inches, along with a minimum barometer reading of 28.81 inches (976 mb). The radius of hurricane force winds was fortunately small and the peak wind reported at Tampa was 59 knots (68mph) with a peak gust of 75 mph recorded atop a tall building in downtown Tampa. The adjusted surface peak wind was later estimated to have been 49 knots (56 mph).

Steamboat Favorite aground in Plant Park,
Credit: State Archives of Florida
Most of the damage done by this storm in Tampa and St. Petersburg was due to the storm surge. The 10.5 foot storm surge in Tampa Bay was the highest since the Great Gale of 1848. The tide swept over the seawall along Bayshore Drive in Tampa flooding some of the most expensive houses in the city. There was considerable flooding in downtown Tampa where 3 people were reported as drowned.

Thomas B Garland driven ashore – Credit:
Florida State Archives collection
At St. Petersburg the tide was reported at 8 feet 5 inches above normal and all four city piers were badly damaged or destroyed. At Egmont Key and at Sanibel island to the south, the tide was reported to have nearly covered both islands with water. Flooding was also severe at Palmetto Beach, Edgewater Park and Desoto Park where some houses had the water rise up to the second story windows. At Palmetto Beach 50 houses were reported destroyed by the tide and by drifting cedar logs that were chained together and had been enroute to the Tampa box company to be made into cigar boxes. Many vessels were wrecked or washed ashore including the “Geneveve”, the “Hypnotist”, the “Pokonoket” and the steamer “Favorite”.
An American vessel SS Truxillo weathered the storm 24 miles west of Edgmont key and reported the following weather in her logbook:
Date/Time Barometer Wind in Beaufort Force
24th Midnight 29.62 East Hurricane Force (73+ mph)
25th 04:00 29.27 East Force 11 (64-72mph)
25th 06:30 29.00 East Hurricane Force (73+ mph)
25th 08:00 28.90 East Hurricane Force (73+ mph)
25th 10:20 28.28 Calm, Terrific cross sea
25th 10:50 28.28 West Hurricane Force (73+ mph)
25th 11:00 28.32 West Hurricane Force (73+ mph)
25th Noon 28.40 West Hurricane Force (73+ mph)
25th 16:00 29.02 West Force 11 (64-72mph)
25th 20:00 29.36 North Force 10 (55-63mph)
25th Midnight 29.48 North Force 9 (47-54mph)
Overall damage was estimated to be at about $3 million (1921 dollars). The total number of hurricane related deaths is unknown but at least 8 deaths were directly related to the storm.

1921 Hurricanes – NOAA NHC
References/Resources:
Barnes, J., 1998: Florida’s Hurricane History. The University of North Carolina Press, Chapel Hill
Bowie, E. H., 1921: The hurricane of October 25, 1921, at Tampa, Fl. Mon. Weather Review v., 49, 567-570.
Ballingurd, David It Could Happen Here St. Petersburg Times
Other Sources:
THE REANALYSIS OF ATLANTIC BASIN TROPICAL CYCLONES FROM THE 1920s: AREEXAMINATION OF THREE CATASTROPHIC HURRICANES THAT IMPACTED FLORIDA By Steven E. Feuer, Christopher W. Landsea, Lenworth Woolcock, and Joyce Berkeley
NOAA/AOML/Hurricane Research Division, Miami, Florida
1921 Hurricane: The Forgotten Nightmare NOAA NWS Tampa Office
The Burgert Brothers Photography Collection – 1921 Hurricane
At the Tampa-Hillsborough County Public Library
Fred Pickhardt
NOAA IR Satellite image of Hurricane Matthew
Hurricane Matthew at 0300 UTC (11pm EDT) was weakening with max winds now at 90 knots and was moving just east of north at 10 knots. Hurricane force winds extend outward 35 NM west and 50 NM east while 50 knot or higher winds extend out 50 NM west and 70-80 NM east. Max significant wave height is about 36 feet (about 11 meters).
During the next 36 hours, Matthew should turn more northeastward moving near the coasts of Georgia and South Carolina during the next 12-18 hours, then near the North Carolina coast from 18-36 hours. Matthew is now forecast to weaken to a tropical storm by 36 hours. After 36 hours the track and intensity forecasts are uncertain.
NHC Forecast Chart
NOAA IR Satellite Image Hurricane Matthew
Hurricane Mathew at 11am EDT 1500 UTC is once again gaining strength with max winds now at 120 knots (about 140 mph). Environmental conditions appear favorable for additional intensification today while Matthew approaches the east coast of Florida.
Currently hurricane force winds extend outward abut 30-50 NM to the west and 40-50N to the east. Damaging 50 knot (58mph) winds extend outward 70 NM except only 40 NM to the southwest. Tropical storm force (gale) winds extend outward 70-100 NM west and 130-140 NM east.
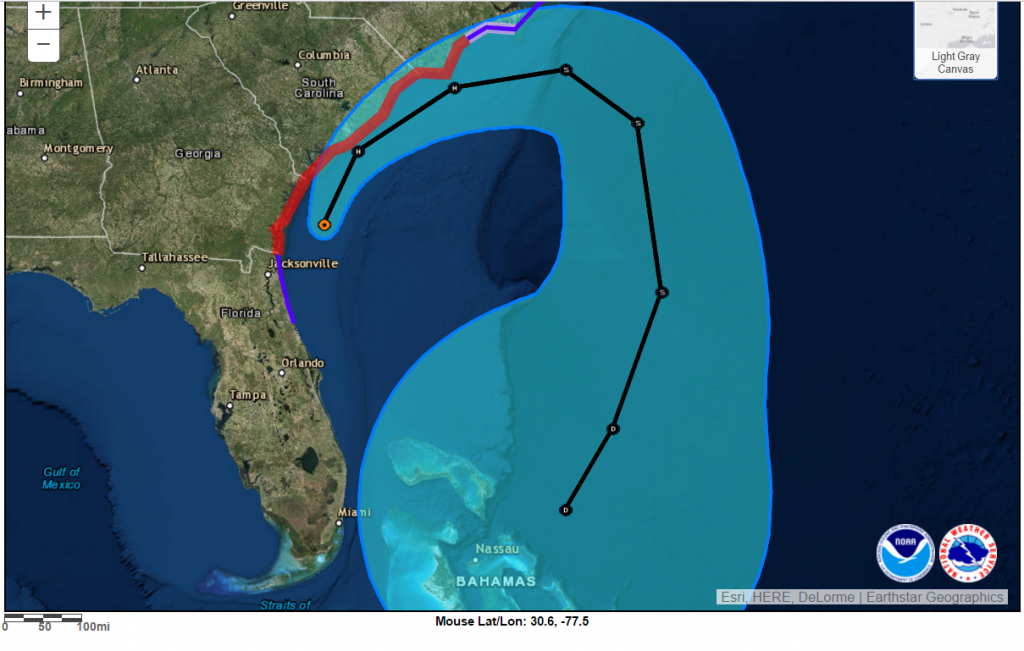
NHC Track Forecast for Hurricane Matthew
After 24 hours, land interaction is likely to cause some weakening, and later in the period increasing shear should cause a more rapid decrease in winds. Matthew is moving toward the northwest or 325 degrees at 10 kt. A turn towards the north-northwest and later northeast is still anticipated.
Matthew is likely to produce devastating impacts from storm surge, extreme winds, and heavy rains in the northwestern Bahamas today, and along extensive portions of the east coast of Florida tonight. By tonight max winds are forecast to be about 125 knts (145mph).

NHC Risk for damaging 50 knot (58mph) or higher wind speeds
When a hurricane is forecast to take a track roughly parallel to a coastline, as Matthew is forecast to do from Florida through South Carolina, it becomes very difficult to specify impacts at any one location. Only a small deviation of the track to the left of the NHC forecast could bring the core of a major hurricane onshore within the hurricane warning area in Florida and Georgia. Modest deviations to the right could keep much of the hurricane-force winds offshore.
NOAA Satellite Image Hurricane Matthew
Hurricane Matthew as of 0300 UTC 6 October 2016 was moving northwestward through the Bahamas. Max winds have weakened a bit to 100 knots, however, satellite imagery indicates that the hurricane is becoming better organized and the central pressure has fallen to 961 mb so some strengthening and a turn towards the N-NW is expected as it approaches the Florida coast.
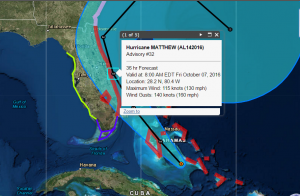
NHC Forecast Track for Hurricane Matthew
Hurricane force winds extend outward 30 NM south and 40 NM north. 50 knot or higher winds extend outward 40NM south and 50-70 NM to the north. Gale force winds extend out 60 NM southwest to 150 NM to the northeast.
Matthew is forecast pass near Andros Island and New Providence in about 12 hours, and then very near the eastern coast of the the Florida peninsula. In about 48-72 hours Matthew is expected to turn northeastward. Some models suggest a turn back towards the south or southwest in the longer term.
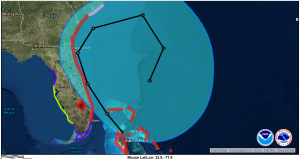
Hurricane Matthew wind field Oct 6th 0000 UTC